Teaching and learning resources
Veterinary epidemiology teaching resources
Notes
An Introduction to Veterinary Epidemiology (2026) Melbourne Veterinary School, Faculty of Science, The University of Melbourne.
Investigation of Spatial Patterns of Animal Disease (2025) Melbourne Veterinary School, Faculty of Science, The University of Melbourne. Data sets to accompany these notes can be downloaded from here.
Descriptive statistics
Descriptive statistics, frequency histograms and transformations.
Confidence intervals for means, proportions, incidence risks and incidence rates.
Critical values from the normal and t distributions .
Reference interval estimation.
Dose rate calculator.
Constant rate infusion calculator.
Measures of association
Measures of association from a 2 × 2 contingency table.
Infectious disease outbreak response
A collection of infectious disease outbreak response tools allowing you to: (1) describe outbreak events over time; (2) geocode addresses (using Open Street Map); and (3) generate a space or space-time KML file.
Time
Frequency histogram of [disease] events as a function of time (an epidemic curve).
Plot the growth phase of an outbreak.
Plot the estimate dissemination ratio (and its confidence interval) as a function of time .
Plot the effective reproduction number (and its confidence interval) as a function of time.
Backward and forward trace date tool.
Wada plot .
Place
Geocode a single address.
Geocode multiple addresses.
Place and time
Generate a space or a space-time KML file using date of event and event location details.
Diagnostic test evaluation
A collection of diagnostic test evaluation tools allowing you to: (1) estimate diagnostic test sensitivity and specificity; (2) estimate pre- and post-test probabilities; and (3) convert apparent prevalence estimates to true prevalence estimates using frequentist and Bayesian approaches. The functions here replicate many of those available in the Epi Toolbox app. Updates to the Epi Toolbox app will appear here first.
Measures of diagnostic test performance from a 2 × 2 contingency table (vanilla).
Measures of diagnostic test performance from a 2 × 2 contingency table.
Pre-test and post-test probabilities (accounting for uncertainty in diagnostic test performance).
Series and parallel diagnostic test interpretation .
Beta buster (adapted from Chun-Lung Su's tool to parameterise beta distributions from elicited values).
Gamma buster (a tool to parameterise gamma distributions from elicited values).
Apparent prevalence and true prevalence (using a Bayesian approach if the Rogan-Gladen estimator invalid).
Bayesian latent class models for diagnostic test performance and prevalence estimation.
Sample size and study power
A collection of sample size and power calculation tools for: (1) estimation of a population parameter; (2) observational study design; (3) clinical trial study design; and (4) proof of freedom studies. The functions here replicate many of those in the Epi Toolbox app. Updates to the Epi Toolbox app will appear here first.
Estimate a population parameter
Simple random sampling (binary data).
Simple random sampling (continuous data).
One stage cluster sampling (binary data).
One stage cluster sampling (continuous data).
Two stage cluster sampling (binary data).
Two stage cluster sampling (continuous data) .
Observational studies
Cross-sectional study.
Cohort study (count data).
Cohort study (time at risk data).
Case-control study.
Comparison of binary outcomes.
Comparison of continuous outcomes.
Comparison of time to event.
Clinical trials
Parallel equivalence trial (binary data).
Parallel equivalence trial (continuous data).
Parallel superiority trial (binary data).
Parallel superiority trial (continuous data).
Parallel inferiority trial (binary data).
Parallel inferiority trial (continuous data).
Disease freedom
Simple random sampling.
Two-stage cluster sampling.
Confounders and colliders
An interactive web application to better understand the effect of confounders and colliders when quantifying cause and effect relationships: (1) binary outcome variable; (2) continuous outcome variable.
Deterministic epidemic models
Susceptible-infected-recovered model (vanilla).
Susceptible-infected-recovered model with interventions.
Susceptible-infected-recovered model with vaccination.
Social network analysis
Descriptive SNA of an edgelist.
Egonet: Plot movements on/off a farm in a network.
Software
The epiR package
An R package for the analysis of epidemiological and surveillance data. Contains functions for directly and indirectly adjusting measures of disease frequency, quantifying measures of association on the basis of single or multiple strata of count data presented in a contingency table, computation of confidence intervals around incidence risk and incidence rate estimates and sample size calculations for cross-sectional, case-control and cohort studies. Surveillance tools include functions to calculate an appropriate sample size for 1- and 2-stage representative freedom surveys, functions to estimate surveillance system sensitivity and functions to support scenario tree modelling analyses.
Click here to access the epiR package from the Comprehensive R Area Network (CRAN).
The incursion package
incursion is an R package for the analysis of infectious disease outbreaks in human and animal populations. The latest version of the incursion package is 0.2-23 (2 December 2025). From R, the package can be installed from GitHub using the following code:
remotes::install_github("mstevenson888/incursion", build_vignettes = TRUE)
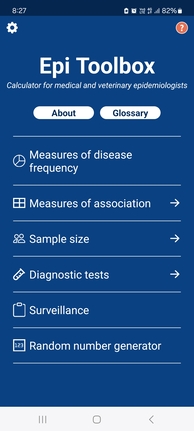
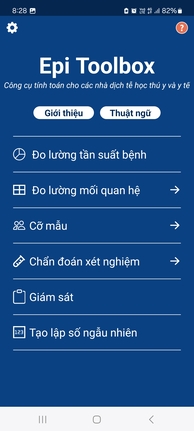
The Epi Toolbox app
The Epi Toolbox app provides an interface to many of the functions available in the epiR package.
Privacy Statement
Last Updated: 15 January 2026
Our commitment to your privacy
As developers of the Epi Toolbox app we believe your privacy is paramount. This privacy statement explains our approach to data collection and use in connection with our mobile application.
Information collection
We do not collect, store, or process any personal information from users of this app. This means:
- We do not collect your name, email address, phone number, or any other identifying information.
- We do not track your location.
- We do not collect device identifiers or advertising IDs.
- We do not use cookies or similar tracking technologies.
- We do not collect usage data or analytics about how you use the app.
Data storage
Since we do not collect any personal information, we do not store any data about you on our servers or any third-party servers. Any data you create or use within the app remains exclusively on your device and is not transmitted to us or any third parties.
Third-party services
This app does not integrate with any third-party services that would collect your personal information.
Children's privacy
Because we do not collect any personal information, our app is safe for users of all ages, including children under 13.
Changes to this privacy statement
We may update this privacy statement from time to time. Any changes will be posted within the app with an updated 'Last updated' date. Your continued use of the app after any changes indicates your acceptance of the updated privacy statement.
Contact us
If you have any questions about this Privacy Statement or our privacy practices, please contact us at: mark.stevenson1 at unimelb.edu.au.

QR links for iOS (left) and Android (right) versions of the app are as follows:


Study
- Veterinary Public Health and Epidemiology
- Bachelor of Science: Animal Disease Biotechnology
- Master of Veterinary Studies: Clinical Residents Program
- Dairy clinical residents - research design and analysis, epidemiology, veterinary public health
- Veterinary hospital clinical residents - research design and analysis